Parameter Modification Performance
I just finished the third and final of my presentations at AU 2008 and had a great time doing so, with enthusiastic and friendly audiences. For a live impression of the atmosphere here, don't miss having a look at Kean's posts on his arrival, first day, and the exhibit hall at AU.
Meanwhile I noticed the following interesting issue on parameter modification performance raised by Michael Raps of the Institut 4D-Technologies and DataSpaces at the Fachhochschule Nordwestschweiz and being explored by Saikat Bhattacharya of our Bangalore office.
Modifying multiple parameters sometimes takes an inordinate amount of time. I noticed something similar myself once running a command which modified parameters on HVAC air terminals. Executing this command in Revit Architecture worked fine and fast, but it took an order of magnitude longer to execute in Revit MEP, because Revit MEP was continuously recalculating and updating the entire duct system every time one of the parameters changed.
Michael's issue is simpler and does not involve any complex regeneration of the entire system by Revit. The problem was that executing the following simple code in a model using a specific custom family took extremely long:
// Start measurement
int millis = Environment.TickCount;

// Set some values
Parameter p = instance.get_Parameter("Breite");
p.Set(500);

// Set some Booleans
p = instance.get_Parameter("Füsse");
p.Set(1);

p = instance.get_Parameter("Sockel");
p.Set(1);

p = instance.get_Parameter("Rille");
p.Set(1);

// Set some strings
p = instance.get_Parameter("Bezeichnung Deutsch");
p.Set("Deutsche Bezeichnung");

p = instance.get_Parameter("Bezeichnung Englisch");
p.Set("English description");

p = instance.get_Parameter("Comments");
p.Set("A comment");

millis = Environment.TickCount - millis;
MessageBox.Show(
  millis + "Millis to set 9 parameters. " +
  " (about " + millis / 9.0 + " millis per param)" );
Michael made use of the profiling functionality provided by the dotTrace profiler for .NET to create the following execution time analysis:
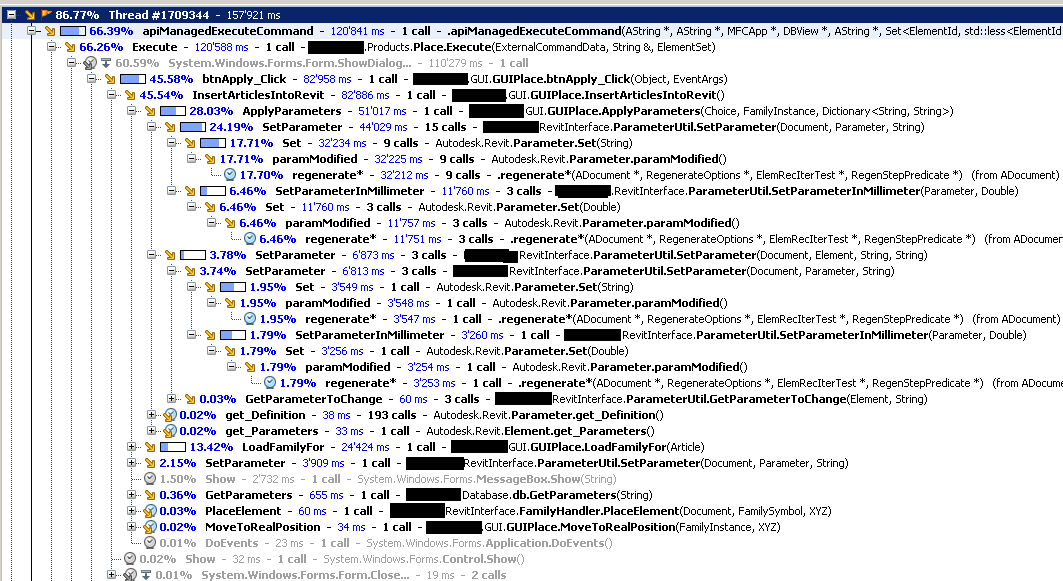
One issue involved here is a known behaviour with parameter bindings and was fixed in the web update version of Revit 2009, so the first step is to ensure that you have the latest build. Even after this update, the performance was still pretty slow, with a large proportion of the execution time spent in an internal function named regenerate():

Saikat then discovered that replacing the custom family by a simpler RFA file such as a rectangular column family caused it to work like a flash. Thus, the delay is partially due to the dataset being used, in this case the family file, and not entirely caused by the Parameter.Set() API call. This is one detail to keep in mind when you run into performance issues setting parameters.