Debugging Revit 2014 API with Visual Studio 2013
The officially supported development platforms for Revit add-ins are Microsoft Visual Studio 2010 and Microsoft Visual Studio 2010 Express Edition.
The important factor is really only the .NET environment, Microsoft .NET Framework 4.0.
Of course, you can also use the built-in SharpDevelop development macro environment.
This information comes directly from the horse's mouth, i.e. the Revit 2014 API Developers Guide – happily, back online again – section on requirements.
The Revit Python Shell and Revit Ruby Shell, based on IronPython and IronRuby respectively, obviously prove that other .NET environments work as well.
Adventurous add-in developers have already been using Visual Studio 2012 for a long time now, and the real pioneers are trying out Visual Studio 2013.
There is a snag with that, though, as Trevor Taylor discovered and discussed in the Revit API thread on debugging Revit 2014 API with Visual Studio 2013.
Happily, Trevor solved the issue himself, twice over.
I think this worthwhile sharing here as well, so here goes:
Question: I've just installed Visual Studio 2013, but can't get it to debug Revit add-ins properly. I'm running VS as admin, .NET 4.0. Projects debug fine in VS 2012, but in VS 2013 the project will start and Revit will load, but all of my modelling commands are disabled. I can switch views, open projects, etc., but I can't, for example, create a wall or run an add-in.
My add-ins run fine outside the debugger, but when debugging the Revit ribbon looks like this with most modelling commands disabled:
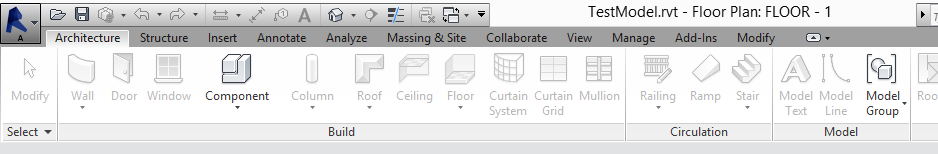
Can anyone tell me how to fix this?
Thanks!
Answer: Have you tried switching to managed compatibility mode?
Response: Compatibility mode causes 2013 debugger to do its duty, but alas, no edit-and-continue.
Answer: Thanks Jeremy! This solution for switching to managed compatibility mode in Visual Studio 2013 > Through the .csproj/.vbproj file – setting the DebugEngines tag – did the trick. This is what it says:
Actually, for the sake of our beloved search engines and to better support copy and paste operations, here is a copy of the original text:
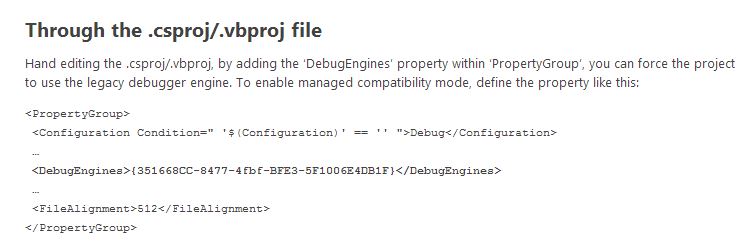
Through the .csproj/.vbproj File
Hand editing the .csproj/.vbproj, by adding the ‘DebugEngines’ property within ‘PropertyGroup’, you can force the project to use the legacy debugger engine. To enable managed compatibility mode, define the property like this:
<PropertyGroup>
  <Configuration Condition=" '$(Configuration)' == '' ">
    Debug
  </Configuration>
  . . .
  <DebugEngines>
    {351668CC-8477-4fbf-BFE3-5F1006E4DB1F}
  </DebugEngines>
  . . .
  <FileAlignment>512</FileAlignment>
</PropertyGroup>
Update: I find that the disabled ribbon problem when debugging with Visual Studio 2013 does not manifest if I compile my code, run Revit 2014 and then attach to process. Using this technique, I can have Managed Compatibility mode toggled off.
- Compile code.
- Configure your .addin file to load your debug DLL.
- Run Revit (confirm that your add-in is loaded).
- In VS 2013, choose Debug > Attach to process.
- Choose Revit.exe.
Unfortunately, there is no huge advantage in this.
E.g., to answer a few questions on my motivation:
- "Why in heaven's name are you doing this?" – Well, by the time it occured to me it occured to me that edit-and-continue couldn't work with a DLL I had already installed VS 2013 and didn't want the additional overhead of also installing VS 2012. Therefore, on I pressed. I discovered the 'attach-to-process' trick when trying to get the beta Revit to debug on a remote computer (since it would crash when I attempted to start it directly.) Attach to Process worked, so I tried it on my Visual Studio 2013 computer with locally installed Revit. Lo and behold, it worked and the ribbon behaved.
- "I mean, what is the advantage?" – None, since it doesn't work! However, if you could use edit and continue it would be like the VBA / LISP days when you could write a problem as you debugged it when we used often to write throw-away code to fix problem in AutoCAD drawings. Code could be written and executed so quickly that it wasn't worth keeping the program since by the time it was needed again it was quicker to re-write it than to find it again. But I'm describing a problem somewhat unique to corporate developers where we often have to address a very specific, often unique occurence.
- "Does edit and continue work with Revit add-ins?" – I wish it did. Maybe in heaven... :-)
Many thanks to Trevor for exploring and solving this issue!
Addendum: Here is an update on this: edit and continue of a Revit 2014 add-in with Visual Studio 2013 may work partially after all, at least in non-graphical views. I am still looking forward to hearing a confirmation of that from someone... Mille grazie!