GeoSnoop .NET Boundary Curve Loop Visualisation
Continuing the research and development for my cloud-based round-trip 2D Revit model editing project, I explained how I use the ExtrusionAnalyzer to create a plan view boundary profile for the furniture and equipment family instances, sort and orient its output curves, and determine their bounding box for visualisation.
Today let's look at a simple loop visualisation implementation in a dynamically generated .NET form.
The components of interest are:
- Point2dInt – an integer-based 2D point
- JtLoop – a closed polygon boundary loop
- JtLoops – a list of boundary loops
- JtBoundingBox2dInt – a bounding box for 2D integer points
- GeoSnoop – display a collection of curves in a .NET form
- Validation of results – reality check
- Next steps – where to go from here
- Download – try this yourself at home
Point2dInt – an Integer-based 2D Point
I introduced this class in the initial discussion on retrieving plan view room boundary polygon loops.
The main idea is to have a robust lightweight data container for passing 2D point information back and forth between my Revit add-in, the cloud and mobile devices.
The later development motivated the addition of a couple of convenience methods since the first publication:
/// <summary>
/// An integer-based 2D point class.
/// </summary>
class Point2dInt : IComparable<Point2dInt>
{
  public int X { get; set; }
  public int Y { get; set; }

  const double _feet_to_mm = 25.4 * 12;

  static int ConvertFeetToMillimetres( double d )
  {
    return (int) ( _feet_to_mm * d + 0.5 );
  }

  /// <summary>
  /// Convert a 3D Revit XYZ to a 2D millimetre
  /// integer point by discarding the Z coordinate
  /// and scaling from feet to mm.
  /// </summary>
  public Point2dInt( int x, int y )
  {
    X = x;
    Y = y;
  }

  /// <summary>
  /// Convert a 3D Revit XYZ to a 2D millimetre
  /// integer point by discarding the Z coordinate
  /// and scaling from feet to mm.
  /// </summary>
  public Point2dInt( XYZ p )
  {
    X = ConvertFeetToMillimetres( p.X );
    Y = ConvertFeetToMillimetres( p.Y );
  }

  /// <summary>
  /// Comparison with another point, important
  /// for dictionary lookup support.
  /// </summary>
  public int CompareTo( Point2dInt a )
  {
    int d = X - a.X;

    if( 0 == d )
    {
      d = Y - a.Y;
    }
    return d;
  }

  /// <summary>
  /// Display as a string.
  /// </summary>
  public override string ToString()
  {
    return string.Format( "({0},{1})", X, Y );
  }

  /// <summary>
  /// Add two points, i.e. treat one of
  /// them as a translation vector.
  /// </summary>
  public static Point2dInt operator+(
    Point2dInt a,
    Point2dInt b )
  {
    return new Point2dInt(
      a.X + b.X, a.Y + b.Y );
  }
}
JtLoop – a Closed Polygon Boundary Loop
This class consists of a simple list of 2D integer points representing a closed boundary loop.
When a new point is added to the collection, it is compared to the last and ignored if they evaluate equal. This automatically suppresses too small boundary segment fragments.
/// <summary>
/// A closed polygon boundary loop.
/// </summary>
class JtLoop : List<Point2dInt>
{
  public JtLoop( int capacity )
    : base( capacity )
  {
  }

  /// <summary>
  /// Display as a string.
  /// </summary>
  public override string ToString()
  {
    return string.Join( ", ", this );
  }

  /// <summary>
  /// Add another point to the collection.
  /// If the new point is identical to the last,
  /// ignore it. This will automatically suppress
  /// really small boundary segment fragments.
  /// </summary>
  public new void Add( Point2dInt p )
  {
    if( 0 == Count
      || 0 != p.CompareTo( this[Count - 1] ) )
    {
      base.Add( p );
    }
  }
}
JtLoops – a List of Boundary Loops
Each room produces a collection of loops, since it may include holes. For the furniture and equipment, I am expecting to manage just one external boundary contour loop each. On the other hand, for the furniture, this class enables me to easily collect all the individual furniture loops together into one single object.
The addition operator + is used to unite the room and furniture loops into a single container to pass to the visualisation method.
The conversion to a list of Point instances is used to feed the System.Drawing.Drawing2D.GraphicsPath class AddLines method to display the loops in a form.
/// <summary>
/// A list of boundary loops.
/// </summary>
class JtLoops : List<JtLoop>
{
  public JtLoops( int capacity )
    : base( capacity )
  {
  }

  /// <summary>
  /// Unite two collections of boundary
  /// loops into one single one.
  /// </summary>
  public static JtLoops operator+( JtLoops a, JtLoops b )
  {
    int na = a.Count;
    int nb = b.Count;
    JtLoops sum = new JtLoops( na + nb );
    sum.AddRange( a );
    sum.AddRange( b );
    return sum;
  }

  /// <summary>
  /// Return suitable input for the .NET
  /// GraphicsPath.AddLines method to display the
  /// loops in a form. Note that a closing segment
  /// to connect the last point back to the first
  /// is added.
  /// </summary>
  public List<Point[]> GetGraphicsPathLines()
  {
    int i, n;

    List<Point[]> loops
      = new List<Point[]>( Count );

    foreach( JtLoop jloop in this )
    {
      n = jloop.Count;
      Point[] loop = new Point[n + 1];
      i = 0;
      foreach( Point2dInt p in jloop )
      {
        loop[i++] = new Point( p.X, p.Y );
      }
      loop[i] = loop[0];
      loops.Add( loop );
    }
    return loops;
  }
}
JtBoundingBox2dInt – a Bounding Box for 2D Integer Points
I discussed the 2D integer-based bounding box implementation last week.
As you can see there, it already includes a handy constructor taking a collection of loops to return their entire bounding box.
I now added properties to return the aspect ratio and a System.Drawing.Rectangle to easily define the visualisation target rectangle and coordinate system transformation:
/// <summary>
/// A bounding box for a collection
/// of 2D integer points.
/// </summary>
class JtBoundingBox2dInt
{
  /// <summary>
  /// Minimum and maximum X and Y values.
  /// </summary>
  int xmin, ymin, xmax, ymax;

  /// <summary>
  /// Initialise to infinite values.
  /// </summary>
  public JtBoundingBox2dInt()
  {
    xmin = ymin = int.MaxValue;
    xmax = ymax = int.MinValue;
  }

  /// <summary>
  /// Return current lower left corner.
  /// </summary>
  public Point2dInt Min
  {
    get { return new Point2dInt( xmin, ymin ); }
  }

  /// <summary>
  /// Return current upper right corner.
  /// </summary>
  public Point2dInt Max
  {
    get { return new Point2dInt( xmax, ymax ); }
  }

  /// <summary>
  /// Return current center point.
  /// </summary>
  public Point2dInt MidPoint
  {
    get
    {
      return new Point2dInt(
        (int)(0.5 * ( xmin + xmax )),
        (int)(0.5 * ( ymin + ymax )) );
    }
  }

  /// <summary>
  /// Return current width.
  /// </summary>
  public int Width
  {
    get { return xmax - xmin; }
  }

  /// <summary>
  /// Return current height.
  /// </summary>
  public int Height
  {
    get { return ymax - ymin; }
  }

  /// <summary>
  /// Return aspect ratio, i.e. Height/Width.
  /// </summary>
  public double AspectRatio
  {
    get
    {
      return (double) Height / (double) Width;
    }
  }

  /// <summary>
  /// Return a System.Drawing.Rectangle for this.
  /// </summary>
  public Rectangle Rectangle
  {
    get
    {
      return new Rectangle( xmin, ymin,
        Width, Height );
    }
  }

  /// <summary>
  /// Expand bounding box to contain
  /// the given new point.
  /// </summary>
  public void ExpandToContain( Point2dInt p )
  {
    if( p.X < xmin ) { xmin = p.X; }
    if( p.Y < ymin ) { ymin = p.Y; }
    if( p.X > xmax ) { xmax = p.X; }
    if( p.Y > ymax ) { ymax = p.Y; }
  }

  /// <summary>
  /// Instantiate a new bounding box containing
  /// the given loops.
  /// </summary>
  public JtBoundingBox2dInt( JtLoops loops )
  {
    foreach( JtLoop loop in loops )
    {
      foreach( Point2dInt p in loop )
      {
        ExpandToContain( p );
      }
    }
  }
}
GeoSnoop – Display a Collection of Curves in a .NET Form
Now comes the exciting part: extracting the loop information from my own data structures, setting up an appropriate .NET form and infrastructure, and passing the information across with a minimum of fuss.
I had some fiddling to do to set this up optimally, I can tell you.
I am very satisfied with the end result, though:
/// <summary>
/// Display a collection of loops in a .NET form.
/// </summary>
class GeoSnoop
{
  /// <summary>
  /// Pen size.
  /// </summary>
  const int _pen_size = 1;

  /// <summary>
  /// Pen colour.
  /// </summary>
  static Color _pen_color = Color.Black;

  /// <summary>
  /// Margin around graphics.
  /// </summary>
  const int _margin = 10;

  /// <summary>
  /// Draw loops on graphics with the specified
  /// transform and graphics attributes.
  /// </summary>
  static void DrawLoopsOnGraphics(
    Graphics graphics,
    List<Point[]> loops,
    Matrix transform )
  {
    Pen pen = new Pen( _pen_color, _pen_size );

    graphics.Clear( System.Drawing.Color.White );

    foreach( Point[] loop in loops )
    {
      GraphicsPath path = new GraphicsPath();

      transform.TransformPoints( loop );

      path.AddLines( loop );

      graphics.DrawPath( pen, path );
    }
  }

  /// <summary>
  /// Display loops in a temporary form generated
  /// on the fly.
  /// </summary>
  /// <param name="owner">Owner window</param>
  /// <param name="caption">Form caption</param>
  /// <param name="loops">Boundary loops</param>
  public static void DisplayLoops(
    IWin32Window owner,
    string caption,
    JtLoops loops )
  {
    JtBoundingBox2dInt bb
      = new JtBoundingBox2dInt( loops );

    // Adjust target rectangle height to the
    // displayee loop height.

    int width = 400;
    int height = (int) (width * bb.AspectRatio + 0.5);

    // Specify transformation target rectangle
    // including a margin.

    int bottom = height - (_margin + _margin);

    Point[] parallelogramPoints = new Point[] {
      new Point( _margin, bottom ), // upper left
      new Point( width - _margin, bottom ), // upper right
      new Point( _margin, _margin ) // lower left
    };

    // Transform from native loop coordinate system
    // to target display coordinates.

    Matrix transform = new Matrix(
      bb.Rectangle, parallelogramPoints );

    Bitmap bmp = new Bitmap( width, height );
    Graphics gr = Graphics.FromImage( bmp );

    DrawLoopsOnGraphics( gr,
      loops.GetGraphicsPathLines(), transform );

    Form form = new Form();
    form.Text = caption;
    form.Size = new Size( width + 7, height + 13 );
    form.FormBorderStyle = FormBorderStyle
      .FixedToolWindow;

    PictureBox pb = new PictureBox();
    pb.Location = new System.Drawing.Point( 0, 0 );
    pb.Dock = System.Windows.Forms.DockStyle.Fill;
    pb.Size = bmp.Size;
    pb.Parent = form;
    pb.Image = bmp;

    form.ShowDialog( owner );
  }
}
I bet you expected more than this, didn't you?
To quote Antoine de Saint-Exupéry: Il semble que la perfection soit atteinte non quand il n'y a plus rien à ajouter, mais quand il n'y a plus rien à retrancher (Perfection is achieved, not when there is nothing more to add, but when there is nothing left to take away).
Validation of Results
Actually, this is the really exciting part.
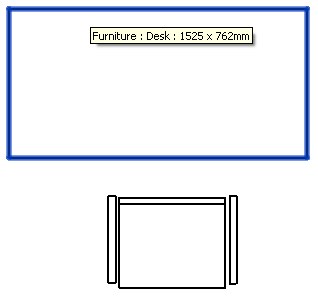
I mentioned that I was worried for a moment about the large number of loop vertices in the plan view of the desk. I was initially hoping for only four vertices, to represent a simple rectangle. After all, the plan view of a desk and chair looks like this in Revit:
In my visualisation, the same desk and chair loops are displayed like this instead:
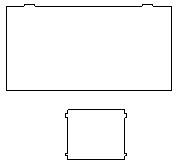
The good news is:
- We have indeed produced closed loops.
- Their shape and location is correct.
Where do all those bumps come from, though?
The answer is easy and completely reassuring: the bumps are the desk drawer handles that stick out a little bit beyond the desktop surface. Looking at a 3D view in Revit from the top, the desk looks like this:

My results reproduce this exactly.
Looking at the chairs, I mentioned that some of the chair solids cause extrusion analyser failures, and I skip those. To be precise, I have two failures on each chair.
Comparing the chair 3D view from the top in Revit with my results shows that the armrests are the components causing trouble:

The rest matches up perfectly, once again validifying my approach. The bumps on the sides of the chairs are the armrest supports.
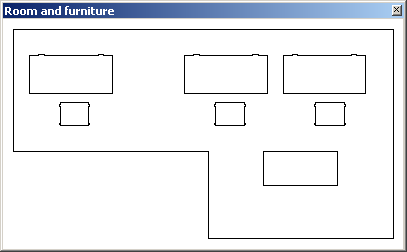
I also cleaned up the form generation as much as possible. Resizing, zooming and panning are not supported. The form aspect ratio is adjusted up front to adapt to the loops to display:
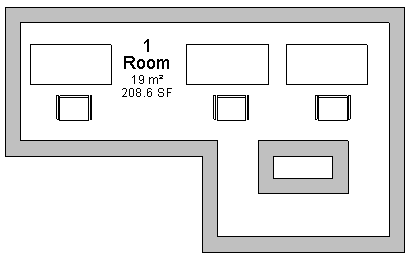
Once again, here is the same view in Revit:
Next Steps
Actually, the next steps are the really, really exciting part.
Now I can turn to the implementation of my data repository and the task of hosting it in the cloud.
I already discussed my tentative plans and high hopes for this. Let's see if I can live up to them.
Adventure! Who knows what will come, and where this will lead?
Download
To wrap this up for the moment, here is GeoSnoopLoops.zip containing the complete source code, Visual Studio solution and add-in manifest of the current state of this external command.