Debugging an Add-in Without Restarting Revit
Here is a question that has come up again and again in recent years:
Question: How can I avoid re-starting Revit after every change to my add-in code? It is very time consuming.
Answer: Unfortunately, the Visual Studio 'Edit and Continue' feature does not work when developing Revit add-ins.
Personally, I set up the Visual Studio project to start up Revit with a testing project already loaded, by appropriately setting up both the 'Start external program' and 'Command line arguments' in the debug properties. Then I can hit Alt-D-E in Visual Studio to stop debugging, edit, recompile, and hit F5 to start up debugging again, continuing within seconds in the same project exactly where I left off, assuming the sample model is not too large. If it is very large and you find you have to restart Revit often, I would suggest simplifying the model in the initial development phases.
To do so, select Solution Explorer > Properties:
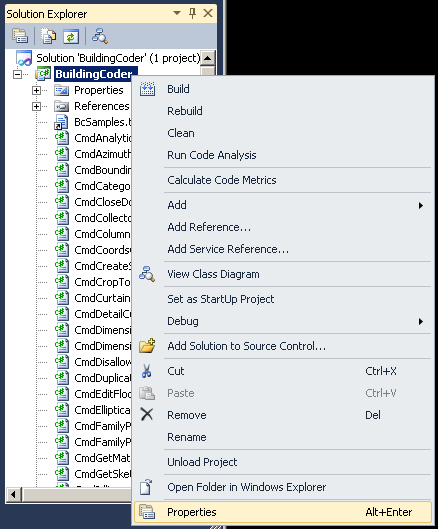
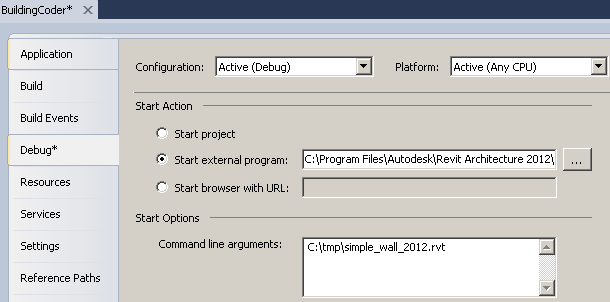
In the project properties, pick the Debug tab, define Revit.exe as the start-up program, and set a Revit project file as the command line argument:
That is efficient enough for me. As said, it is slower if you are forced to perform your debugging in a large Revit model that takes a long time to load, of course.
Another partial work-around that I very seldom use is to run Revit inside of the Visual Studio debugger with my project opened, like normal. If I really want to edit some of the source files and continue debugging at the same time, I open the same project once again in another instance of Visual Studio.
Several workarounds have been proposed for reloading an add-in to debug, dynamically loading a plug-in from a byte array in memory instead of a file on the hard disk, and using the Revit Python shell.
Alternatively, and officially supported, you can make use of VSTA, converting the code you are currently working on, i.e. actively debugging and editing, to a VSTA macro. VSTA will allow you to debug, edit and retest the code without having to restart Revit or reload the model.
The Revit API DevTV Part 2 shows how to use 'Attach to Process' in Visual Studio instead of starting Revit from the Visual Studio debugger to edit your code and continue debugging within the same Revit session. Unfortunately, on the 64 bit OS, there is also a limitation in Visual Studio itself which does not support the Edit and Continue functionality on that platform at all.
I already pointed out repeatedly that the Add-In Manager allows you to unload and reload an add-in without restarting Revit. For more details, please refer to the Add-In Manager help file. In its Revit 2012 incarnation, it is by default installed as
- "C:\Program Files\Autodesk\Add-In Manager for Autodesk Revit 2012\AddInManagerHelpENU.chm"
It states the following:
Change the way of developing and debugging add-ins
Usually, when developing and debugging an add-in with the Revit API, user has to close & re-open Revit each time he/she modifies the add-in code and wants to re-compile. But with Add-In Manager 2011, user can modify and run the add-in directly without closing & re-opening Revit again and again (find more details from Develop & Debug add-ins with Add-In Manager).
However, it does not seem possible to edit code while debugging a Revit add-in even if it is loaded using the Add-In Manager:
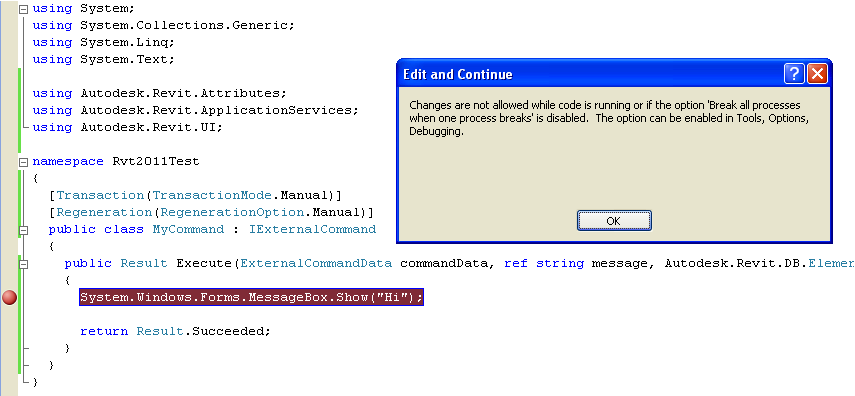
It can only be modified once the debug process is stopped – however, if Visual Studio is still attached to Revit, then stopping the debugging session also closes Revit.
So it seems you cannot avoid first Detaching from Revit and then stop debugging and recompile, then Attach to Revit again if you want to debug your add-in.
If you just want to be able to run a command from your add-in, then modify the code, then run the updated code WITHOUT debugging, then that's fine.
Also, re-reading the text from the Add-In Manager help file, it seems like by 'debugging' it may simply mean 'testing your add-in', and not the actual debugging process, including hitting breakpoints, stepping through the code, checking variable values, etc.
Here are two suggestions by Adam Nagy on using the Add-In Manager with 'Detach All' and Debugger.Break:
Add-In Manager and Detach All
- Set up 'Start external program' and 'Command line arguments' as shown above.
- Start debugging your project, which will start up Revit.
- Run your command using Add-In Manager:
- Inside Revit, go to Add-Ins > External > External Tools > Add-In Manager.
You can use either Manual or Automatic mode, depending on your project's TransactionMode attribute.
Note: In Revit 2011, you had to ensure that both TransactionMode and RegenerationOption were set to the same value, otherwise the Add-In Manager was unable to load the add-in. In Revit 2012, only the manual regeneration option is available. - Click 'Load' and locate your add-in DLL.
- The command will be listed in the window, so you can just select the one you want and click 'Run'.
If you want to run the same command again from your add-in, then you can just click Add-Ins > External > External Tools > Add-In Manager (..., Faceless).
- Inside Revit, go to Add-Ins > External > External Tools > Add-In Manager.
You can use either Manual or Automatic mode, depending on your project's TransactionMode attribute.
- As you can see, your breakpoints will be hit just fine.
- Once your command finishes executing, you can modify your code if you need to by stopping debugging. Before you do that, you need to detach from Revit, so that it won't be stopped as well:
- Inside Visual Studio click Debug > Detach All, then stop debugging.
- Once you modified your code and recompiled it, you can attach to Revit again:
- Click Debug > Attach to Process...
- Select Revit.exe from the list and make sure that the 'Attach to:' field only talks about debugging Managed Code, because if Native is selected as well you might not be able to detach from Revit without stopping it.
- Click 'Attach'.
- Now you can run your command again using Add-In Manager as explained above.
Add-In Manager and Debugger.Break()
- Place a call to the System.Diagnostics.Debugger.Break method somewhere in your code where it will definitely be hit when your command is run, e.g. at the beginning of your command's Execute method, and compile your project.
- Start Revit directly, not through Visual Studio's Debug command.
- Run your command using the Add-In Manager as described above.
- The 'Visual Studio Just-In-Time Debugger' dialog will pop up.
- Select the already open instance of Visual Studio from the list and click 'Yes'.
- Now you can debug your code.
- If you want to modify your code once it finished executing, you can simply click Debug > Stop Debugging. You do not need to detach from Revit this time to avoid it being closed.
- Once you modified your code, you can recompile it and run it again using the Add-In Manager.