Performance Profiling
I should be preparing my Revit API training in Warsaw, which is coming up next week, and instead I still find myself working on other more interesting topics such as performance profiling at the same time. I hope the training participants will find this interesting as well.
New Filtering Motivates Benchmarking
The reason why I am so urgently interested in this right now is that the Revit 2011 API provides a whole new filtering API, i.e. for extracting certain specific groups of elements from the Revit database. This is a task that almost every application faces. The new API is extremely powerful and flexible and provides a huge number of classes and methods that can be used and put together in many different ways to achieve the same result. I am very interested in discovering how to make optimal use of this, and you should probably be too. One important tool in order to be able to measure and compare the performance of different approaches is a profiler, which leads me to this post.
Quick and Slow Filters
Actually, I am rather getting ahead of myself here, because there are so many basic issues that should really be addressed and discussed first. One of the most fundamental ones is that the Revit 2011 filtering API provides a number of filter classes, and they are divided into quick and slow filters. A quick filter is fast and can process an element without fully expanding it in memory, whereas a slow filter needs to read in the entire element data into memory before it can be processed and thus requires more time. Obviously, the trick in performant filtering in Revit 2011 is to apply as many and specific quick filters as possible before resorting to the slow ones, if your search requires them at all. Once the filter has done its job, you have a collection of elements, and in some cases, you may want to postprocess these further to search for characteristics that are not directly supported by any filters, or harder to implement using them. Anyway, we will discuss these topics more in depth real soon now.
To give you a quick first impression of what Revit 2011 API filters can look like, here are two helper methods used in the code presented below. The first one returns the first family symbol found with a built-in category OST_StructuralColumns, which we use to create lots of new column instances in the model:
FamilySymbol GetColumnType()
{
  FilteredElementCollector columnTypes
    = new FilteredElementCollector( m_document );

  columnTypes.OfCategory(
    BuiltInCategory.OST_StructuralColumns );

  columnTypes.OfClass( typeof( FamilySymbol ) );
  return columnTypes.FirstElement() as FamilySymbol;
}
The second returns a list of all levels in the model:
IList<Level> GetLevels()
{
  FilteredElementCollector a
    = new FilteredElementCollector( m_document );

  a.OfCategory( BuiltInCategory.OST_Levels );
  a.OfClass( typeof( Level ) );
  return a.ToElements().Cast<Level>().ToList<Level>();
}
Both of these use quick filters exclusively.
Profiling Tool
So in order to enable you to immediately do some research on and profiling of the new filtering on your own, I want to get this basic profiling tool set up and available to you as soon as possible. This post was prompted by Marcelo Quevedo of hsbSOFT, starting with the following conversation:
[M] I am investigating performance, because we received a huge Revit file and our framing Revit command is spending too much time on it.
I am using a very manual mode to identify the delays. I created a timer by using the QueryPerformanceCounter and QueryPerformanceFrequency methods from the Windows Kernel32.dll.
I call the timer and add the seconds for each call to some of the Revit API functions.
I tried to use the JetBrains dotTrace profiling tool for .Net, but it doesn�t work with Revit 2011. If you know of a profiling tool that works with Revit 2011, please let me know.
[J] Thank you very much for your nice manual profiling tools and examples!
No, I do not know of a profiling tool that works for Revit, which is why I was curious.
By the way, I am sure that you can simplify the calling and usage of the timer very significantly by some clever use of constructors and destructors.
[M] I followed your recommendations and changed the timer. Instead of using a clever destructor, I am using the System.IDisposable interface so that you can use the using statement to identify the delay of a source code portion.
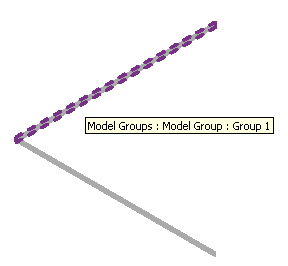
I attached a C# project in which this manual profiling tool is used. This project defines a simple Revit command that creates hundreds of structural columns and groups them in order to test the delay in various Revit API methods. Here are the resulting two groups:
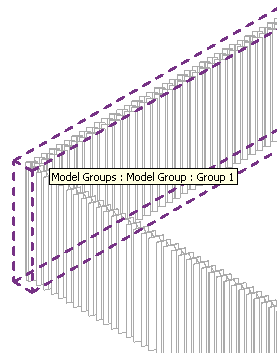
Here are the columns, which are only visible individually when we zoom in a bit closer:
The performance timer implementation makes use of the CodeProject High-Performance Timer in C#.
[J] I cleaned it up a bit more:
- Modified the collection to use a dictionary instead of manually searching for entries by key.
- Rewrote the GetColumnType and GetLevels methods.
- Sorted the output by percentage of time.
Here is the implementation of the basic Timer class that we use:
public class Timer
{
  [DllImport( "Kernel32.dll" )]
  private static extern bool QueryPerformanceCounter(
    out long lpPerformanceCount );

  [DllImport( "Kernel32.dll" )]
  private static extern bool QueryPerformanceFrequency(
    out long lpFrequency );

  private long startTime, stopTime;
  private long freq;

  /// <summary>
  /// Constructor
  /// </summary>
  public Timer()
  {
    startTime = 0;
    stopTime = 0;
    if( !QueryPerformanceFrequency( out freq ) )
    {
      throw new Win32Exception(
        "high-performance counter not supported" );
    }
  }

  /// <summary>
  /// Start the timer
  /// </summary>
  public void Start()
  {
    Thread.Sleep( 0 ); // let waiting threads work
    QueryPerformanceCounter( out startTime );
  }

  /// <summary>
  ///Stop the timer
  /// </summary>
  public void Stop()
  {
    QueryPerformanceCounter( out stopTime );
  }

  /// <summary>
  /// Return the duration of the timer in seconds
  /// </summary>
  public double Duration
  {
    get
    {
      return ( double ) ( stopTime - startTime )
        / ( double ) freq;
    }
  }
}
Marcelo implemented a PerfTimer class add some syntactic sugar and the IDisposable wrapper to the Timer class and make it easier and more automatic to start and stop for a specific call with a minimum of effort and coding. Here is the PerfTimer implementation:
public class PerfTimer : IDisposable
{
  private string _key;
  private Timer _timer;
  private double _duration = 0;

  /// <summary>
  /// Gets time in seconds
  /// </summary>
  public double Duration
  {
    get { return _duration; }
  }
  /// <summary>
  /// Performance timer
  /// </summary>
  /// <param name="what_are_we_testing_here">
  /// Key describing code to be timed</param>
  public PerfTimer( string what_are_we_testing_here )
  {
    _key = what_are_we_testing_here;
    _timer = new Timer();
    _timer.Start(); //starts the time
  }

  void IDisposable.Dispose()
  {
    // When the using statement block finishes,
    // the timer is stopped, and the time is
    // registered

    _timer.Stop();
    _duration = _timer.Duration;
    TimeRegister.AddTime( _key, _duration );
  }
}
After preparing all this, I noticed the following comment on the CodeProject Timer class: "System.Diagnostics.Stopwatch class: .NET 2.0 now provides this functionality as part of the framework. See class: System.Diagnostics.Stopwatch in System.dll." I rewrote the PerfTimer class to make use of the built-in stopwatch instead of reinventing the wheel, and it now looks like this:
public class PerfTimer : IDisposable
{
  #region Internal TimeRegistry class
  // . . .
  #endregion // Internal TimeRegistry class

  string _key;
  Stopwatch _timer;
  double _duration = 0;

  /// <summary>
  /// Performance timer
  /// </summary>
  /// <param name="what_are_we_testing_here">
  /// Key describing code to be timed</param>
  public PerfTimer( string what_are_we_testing_here )
  {
    _key = what_are_we_testing_here;
    _timer = Stopwatch.StartNew();
  }

  /// <summary>
  /// Automatic disposal when the the using statement
  /// block finishes: the timer is stopped and the
  /// time is registered.
  /// </summary>
  void IDisposable.Dispose()
  {
    _timer.Stop();
    _duration = _timer.Elapsed.TotalSeconds;
    TimeRegistry.AddTime( _key, _duration );
  }

  public void Report()
  {
    TimeRegistry.WriteResults( _duration );
  }
}
The internal TimeRegistry class was initially defined by Marcelo and manages a collection of individual timer instances for measuring the time required by the various different Revit API methods. I pretty much rewrote it from scratch in various iterations. At the end of the session, it reports the total times of the various operations, for instance like this:
-----------------------------------------------------------
 Percentage   Seconds   Calls   Process
-----------------------------------------------------------
      2.76%      0.90    7200   Parameter.Set
      3.29%      1.07    1200   NewFamilyInstance
     15.44%      5.04       1   Creation.Document.NewGroup
     18.02%      5.89    1200   Document.Rotate
     59.19%     19.33    1201   Document.Regenerate
    100.00%     32.67       1   TOTAL TIME
-----------------------------------------------------------
The command mainline Execute method driving the whole operation now looks like this:
public Result Execute(
  ExternalCommandData commandData,
  ref string message,
  ElementSet elements )
{
  Result result = Result.Failed;
  try
  {
    m_document = commandData.Application.ActiveUIDocument.Document;
    m_createDoc = m_document.Create;

    // Keep track of the total time used:

    PerfTimer ptTotalTime = new PerfTimer( "TOTAL TIME" );
    using( ptTotalTime )
    {
      ModelColumns();
      using( PerfTimer pt = new PerfTimer( "Document.Regenerate" ) )
      {
        m_document.Regenerate();
      }
    }

    // Report all resulting time delays in a text file:

    ptTotalTime.Report();
    result = Result.Succeeded;
  }
  catch( System.Exception e )
  {
    message = e.Message;
    result = Result.Failed;
  }
  return result;
}
As you can see, it defines a top level performance time measuring the total time, which includes all the detailed time measurements for the individual methods.
All the real action takes place in the ModelColumns method.
Some of the actions performed and timed by ModelColumns include:
- Creating a large number of column instances.
- Setting parameters on the column instances.
- Rotating the column instances.
- Creating groups.
You can see some of the others from the performance report displayed above.
Here is an example showing how easy it is to add a performance timer for a specific method and which generates the corresponding entry for Document.Rotate in the report listed above:
  using( PerfTimer profiler
    = new PerfTimer( "Document.Rotate" ) )
  {
    rotated = m_document.Rotate(
      element, axis, dAngle );
  }
Manual Regeneration Mode
Another interesting issue that Marcelo encountered concerns the regeneration mode. The regeneration mode for this command is set to Manual, which implies that Revit does not automatically regenerate the model after each modification. Instead, we are responsible for doing this ourselves manually by calling doc.Regenerate when required from within our plug-in:
[M] If I set the regeneration mode to Manual, I need to call SetLocationPoint a second time after the call to Rotate, otherwise the column is modelled in a wrong position.
[J] Try calling doc.Regenerate after modifying things before trying to read the results, or use automatic regeneration.
[M] If I call doc.Regenerate after creating each column it works fine, so it is not necessary to set the start point twice anymore.
I cleaned it up bit more and deleted the unused SetLocationPoint method. But doc.Regenerate is now called hundreds of times which causes a new delay. Is it ok to do this, or do you suggest some other alternative?
[J] Yes, of course you should avoid calling doc.Regenerate hundreds of times if possible. You should only call it at all if you have the following situation:
- You have modified the model AND
- You need to query the modified model.
I would assume that it is better to avoid this, or, if not possible, to make all the modifications in one go, then call doc.Regenerate once only, and then perform all the queries at once in a single second step. This is a pure untested assumption at this time and needs testing and benchmarking.
Generic Programming with Anonymous Methods
I am really getting into these neat little anonymous methods that go so well with the new LINQ and generic methods. If you look at the little report above, you will note that I print the percentage of the total time used at the beginning of the line. I put it in that order to make it easy to sort the lines by percentage, since that is the most important aspect of the profiling results. I also wanted to add those separator lines and make them long enough to span the longest lines, but not too long. So what is the maximum line length? How can I ask the compiler to calculate the longest line length for me? Using a generic template algorithm and an anonymous method, this is really easy:
  string header =
    " Percentage   Seconds   Calls   Process";

  int n = Math.Max( header.Length,
    lines.Max<string>( x => x.Length ) );
Rather sweet, isn't it? The Max template algorithm takes a functor which transforms each string element into an integer, and then returns the maximum integer value as its result. In this case, the functor is implemented using an anonymous or lambda function.
You will be seeing a lot more of these in upcoming posts, since I like to use them for succinctly post-processing Revit API filter collector results. I have already benchmarked some variations and established that they are neither more nor less effective than other mechanisms. But once again I am getting ahead of myself and will slow down a bit. More on this anon.
Download
Here is the complete ModelColumns source code and Visual Studio solution after the numerous iterations back and forth between Marcelo and Jeremy to perfect various aspects.
Very many thanks to Marcelo for initiating the topic, sharing his code, the fruitful discussion and the many code improvement iterations!
I am very much looking forward to making use of this system to benchmark and compare the numerous different approaches that can be chosen to make use of the new Revit 2011 API functionality. I hope it will be useful for you as well, and may all your solutions be optimal.