Yesterday, I implemented a pretty minimal Heroku-hosted node.js web server and used it to display some SVG graphics.
I implemented a little interactive form and used the following JavaScript snippet to invoke the server and submit the data entered to it:
function submit_form_svg_01(path_data)
{
  var local = false;
  var base_url = local
    ? 'http://127.0.0.1:5000'
    : 'https://shielded-hamlet-1585.herokuapp.com';
  var w = 400;
  var h = 400;
  var d = path_data.replace(' ','+');
  var query_string = 'w='+w+'&h='+h+'&d='+d;
  window.open(base_url + '?' + query_string,
    'node_server', 'width=' + w + ',height = ' + h);
}
Today, in The Building Coder discussion on sending a room boundary to an SVG node web server, I describe a Revit add-in to drive the exact same web server with polygon data retrieved from the boundary of a room element in a BIM, or building information model, i.e., a 3D architectural design document.
The interesting part is really the C# .NET method analogue to the JavaScript snippet above:
  /// <summary>
  /// Invoke the SVG node.js web server.
  /// Use a local or global base URL and append
  /// the SVG path definition as a query string.
  /// Compare this with the JavaScript version used in
  /// http://the3dwebcoder.typepad.com/blog/2015/04/displaying-2d-graphics-via-a-node-server.html
  /// </summary>
  void DisplaySvg( string path_data )
  {
    var local = false;

    var base_url = local
      ? "http://127.0.0.1:5000"
      : "https://shielded-hamlet-1585.herokuapp.com";

    var d = path_data.Replace( ' ', '+' );

    var query_string = "d=" + d;

    string url = base_url + '?' + query_string;

    System.Diagnostics.Process.Start( url );
  }
Pretty neat, the similarities, aren't they?
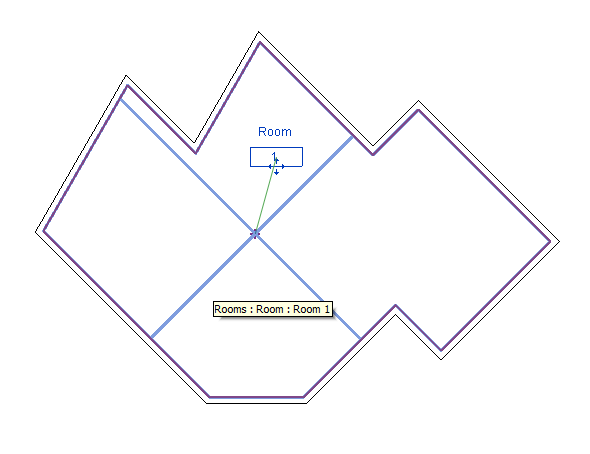
Here is what a weird-shaped sample room can look like in Revit:

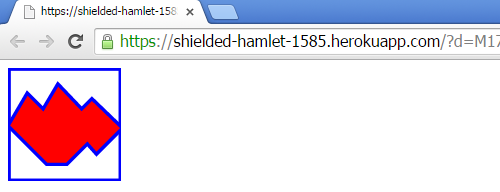
Extracting its boundary loop and using that to define the SVG path data produces this result:

Please refer to The Building Coder discussion on sending a room boundary to an SVG node web server for all further details.